Introduction
Monitoring isn’t just a job; it’s a crucial part of managing systems. It helps you understand how your system is performing, find problems, and make it work better. This article shows you how to set up a strong monitoring system using Prometheus, Grafana, and node_exporter, all managed with Docker Compose. We’ll explain why each setting is important, not just how to do it
Prerequisites
Docker and Docker Compose: Ensure Docker and Docker Compose are installed on your server.
Setup Prometheus
- Create a docker-compose.yml file with the following content.
 1
 2
 3
 4
 5
 6
 7
 8
 9
10
11
12
13
14
15
16
17
18
19
20
21
22
23
24
25
26
27
28
29
|
version: '3.8'  # Docker Compose version

networks:  # Define networks for the services
  monitoring:  # Name of the network
    driver: bridge  # Use the bridge driver

volumes:
  prometheus_data: {}  # Prometheus data volume

services:
  prometheus:
    image: prom/prometheus:latest
    container_name: prometheus
    restart: unless-stopped
    volumes:  # Mount volumes for configuration and data
      - ./prometheus.yml:/etc/prometheus/prometheus.yml  # Mount the Prometheus configuration file
      - prometheus_data:/prometheus  # Mount the Prometheus data volume
    command:
      - '--config.file=/etc/prometheus/prometheus.yml'  # Path to the configuration file
      - '--storage.tsdb.path=/prometheus'  # Path to store the time-series database data
      - '--web.console.libraries=/etc/prometheus/console_libraries'  # Path to console libraries
      - '--web.console.templates=/etc/prometheus/consoles'  # Path to console templates
      - '--web.enable-lifecycle'  # Enable lifecycle
    expose:  # Expose ports from the container
      - 9090  # Prometheus web UI port
    ports:  # Map ports from the container to the host
      - "30150:9090"  # Map container port 9090 to host port 30150
    networks:  # Attach the service to the monitoring network
      - monitoring
|
- Create a prometheus.yml file in the same directory with your Prometheus configuration.
1
2
3
4
5
6
7
|
global:  # Global configuration settings for Prometheus
  scrape_interval: 30s  # How often to scrape targets (30 seconds in this case)
scrape_configs:
  - job_name: 'prometheus'
    scrape_interval: 30s  # How often to scrape this job (30 seconds in this case)
    static_configs:  # Define static targets to scrape
      - targets: ['localhost:9090']  # The target to scrape (Prometheus itself in this case, running on localhost:9090)
|
-
Run docker-compose up -d to start Prometheus in the background.
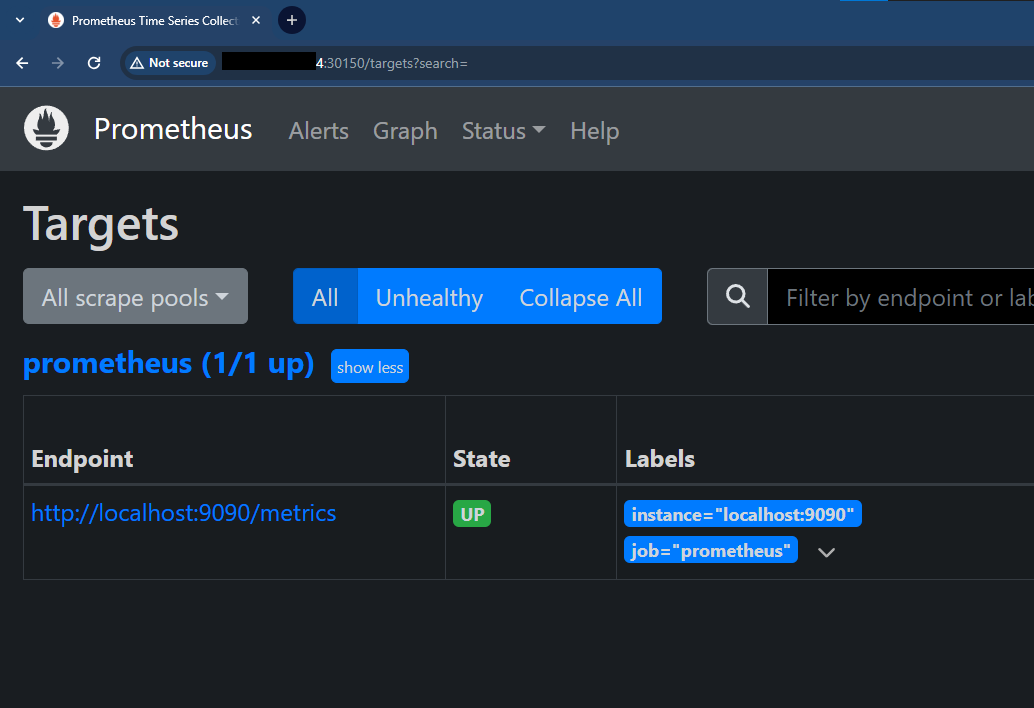
-
Go to your serverip:30150/targets to check the services.
Setup Grafana
- Add the following service to your existing docker-compose.yml file:
 1
 2
 3
 4
 5
 6
 7
 8
 9
10
11
12
13
|
  grafana:
    image: grafana/grafana:latest
    container_name: grafana
    ports:
      - 30160:3000  # Map container port 3000 to host port 30160
    restart: unless-stopped
    environment:
      - GF_SECURITY_ADMIN_USER=admin  # Set the admin user for Grafana
      - GF_SECURITY_ADMIN_PASSWORD=grafana  # Set the admin password for Grafana
    volumes:  # Mount volumes for Grafana configuration
      - ./grafana:/etc/grafana/provisioning/datasources  # Mount the Grafana configuration directory
    networks:  # Attach the service to the monitoring network
      - monitoring
|
-
Run docker-compose up -d to start Grafana in the background.
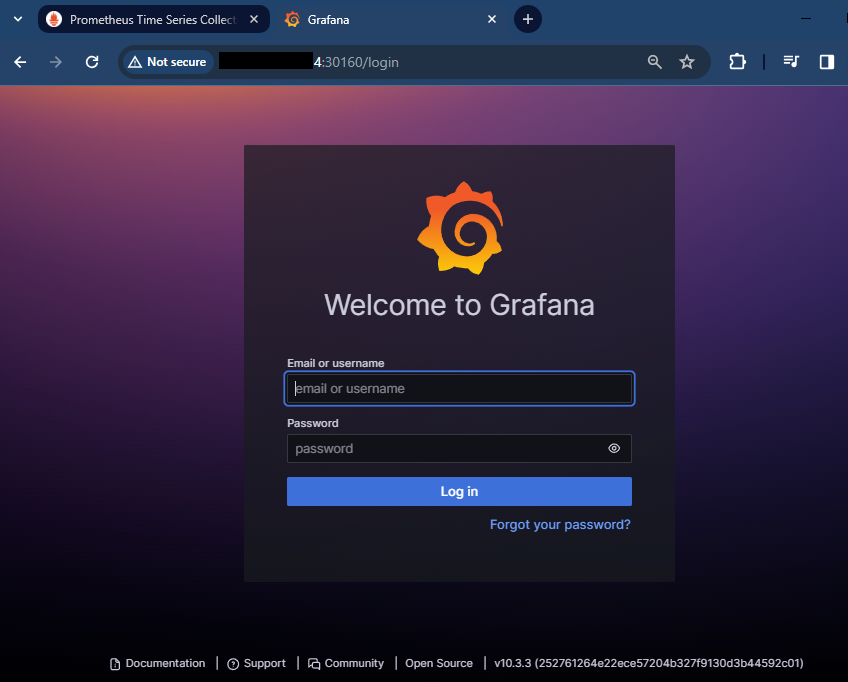
-
Go to your serverip:30160 to check the services.
Node Exporter
- Add the following service to your existing docker-compose.yml file:
 1
 2
 3
 4
 5
 6
 7
 8
 9
10
11
12
13
14
15
16
17
|
  node-exporter:
    image: prom/node-exporter:latest
    container_name: node-exporter
    restart: unless-stopped
    volumes:
      - /proc:/host/proc:ro  # Mount the proc directory from the host
      - /sys:/host/sys:ro  # Mount the sys directory from the host
      - /:/rootfs:ro  # Mount the root filesystem from the host
    command:
      - '--path.procfs=/host/proc'  # Path to the procfs directory
      - '--path.rootfs=/rootfs'  # Path to the root filesystem
      - '--path.sysfs=/host/sys'  # Path to the sysfs directory
      - '--collector.filesystem.mount-points-exclude=^/(sys|proc|dev|host|etc)($$|/)'  # Exclude certain filesystem mount points from collection
    expose:
      - 9100  # Expose ports from the container
    networks:  # Attach the service to the monitoring network
      - monitoring
|
- Run
docker-compose up -d to start Node Exporter in the background.
This setup will deploy Prometheus, Grafana, and Node Exporter containers, allowing you to monitor your environment easily.
Configurate Grafana Dashboard
-
Go to the Grafana URL provided in the Grafana setup step and log in using the credentials found in the docker-compose file.
-
Once logged in, navigate from the sidebar to Configuration -> Data Sources -> Add new Data Source.
Search for Prometheus and select it. Fill in the following information:
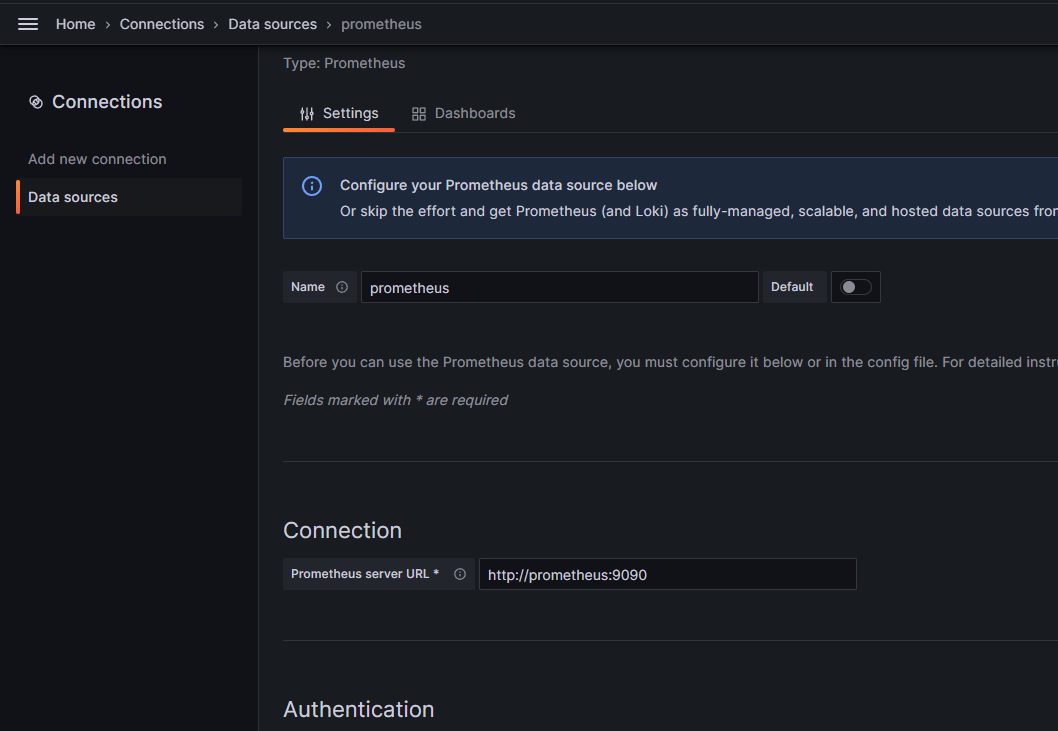
-
Scroll down and click Save & Test. This will test the connection to your Prometheus server.
You now have a data source configured for your system data in Grafana.
-
Go to the Dashboard section and create a new dashboard. Click on Import Dashboard.
-
Enter the ID of the dashboard you want to import. Since we are using the “Node Exporter Full” dashboard from Grafana, enter the ID “1860” and click Load.
-
Now you’ll see the amazing insights and visualizations provided by the “Node Exporter Full” dashboard in Grafana, giving you a comprehensive view of your system’s metrics.
Conclusion
In this tutorial, we have successfully set up a robust monitoring stack using Prometheus, Grafana, and node_exporter, orchestrated through Docker Compose. We configured Prometheus to scrape metrics from our system and Grafana to visualize these metrics in a dashboard. By following these steps, you now have a powerful monitoring solution for understanding the performance of your system, detecting anomalies, and optimizing resources. Monitoring is not just a task; it’s an essential part of system administration that helps you keep your systems running smoothly.